Reporting
Our solutions > Our products > Reporting

Automatic analysis
If you already have a database, it is possible for you, before creating your inquiry, to opt for the automatic analysis option. After importing your database on Seerus engine, a click on the " automatic analysis " button enables you to cross and instantly analyze all of the variables side-by-side in order to determine whether relationships (correlation + or -, relationship of dependence , ...) between these variables exist. The most relevant proved relationships will be highlighted to help you in structuring your survey and creating your questions. Of course, it is also possible to manually determine the variables to be analyzed jointly according to your needs.
Real time reporting
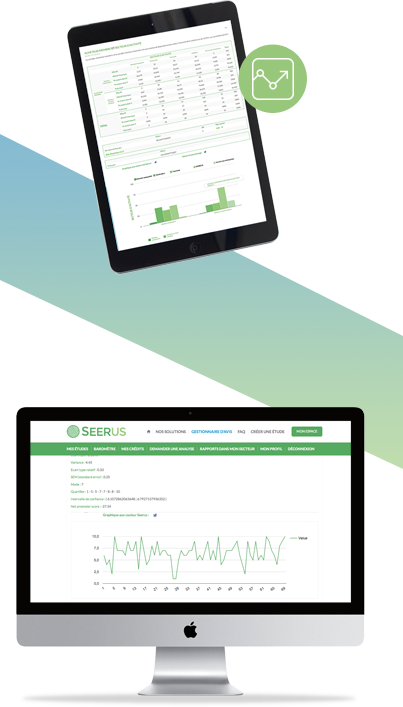
Once your survey is launched, you can check the results at one glance and in real time. Depending on the type of variable (qualitative or quantitative) and for each question, a set of descriptive statistics as well a chart is generated. Concerning the answers to open questions, they are to be found in the Excel report directly downloaded from the website for each study conducted.
Download results
Reports can be generated in PDF or Excel format. Each question appears individually on a page with the title, description, graphic and descriptive statistics of its own.With the export in Excel, you access your survey results in a table form. From there, it is also possible to easily add graphics that adapt based on the filters you may want to make in your data base.
API
A survey may be conducted continuously rather than occasionally (especially the case for some satisfaction studies). With the API system and the channel it creates between your database and the tool Seerus, new data collected will be taken into account and the results will be updated in real time. Also, if you make several surveys over the year (individually or continuous), each survey is no longer a fresh start. Indeed, coupled with the import database function, the API enables the adaptation of your surveys (at the level of the questions asked) based on those made previously. For each of your respondents, the survey is individualized according to the information already owned by the generation of a unique URL link. Thanks to this functionality, you only ask your respondents for information you still need. You can also compare the evolution of the opinions of your respondents in time.
Respondents flow
For each live survey, a set of information is at your disposal in the section “my space”. After clicking on a survey, a summary and table enable you to view certain characteristics about your respondents. It is, for example, possible to visualize the geographical position of the respondents as well as the number of clicks and real-time respondents. The specific characteristics of each of your respondents are available in the Excel extraction of the data base (that has been created, completed or imported in the study).